The Multi-Million Mistake Most Founders Make
Dear GTM Strategists!
Meet the person who has been challenging me the most about the scaling stage on GTM on LinkedIn :D
As you probably know by now, GTM fit is a wonderful moment in time when stars align and you've got yourself a predictable and scalable go-to-market (GTM) motion. Yet the route to get there could be rocky.
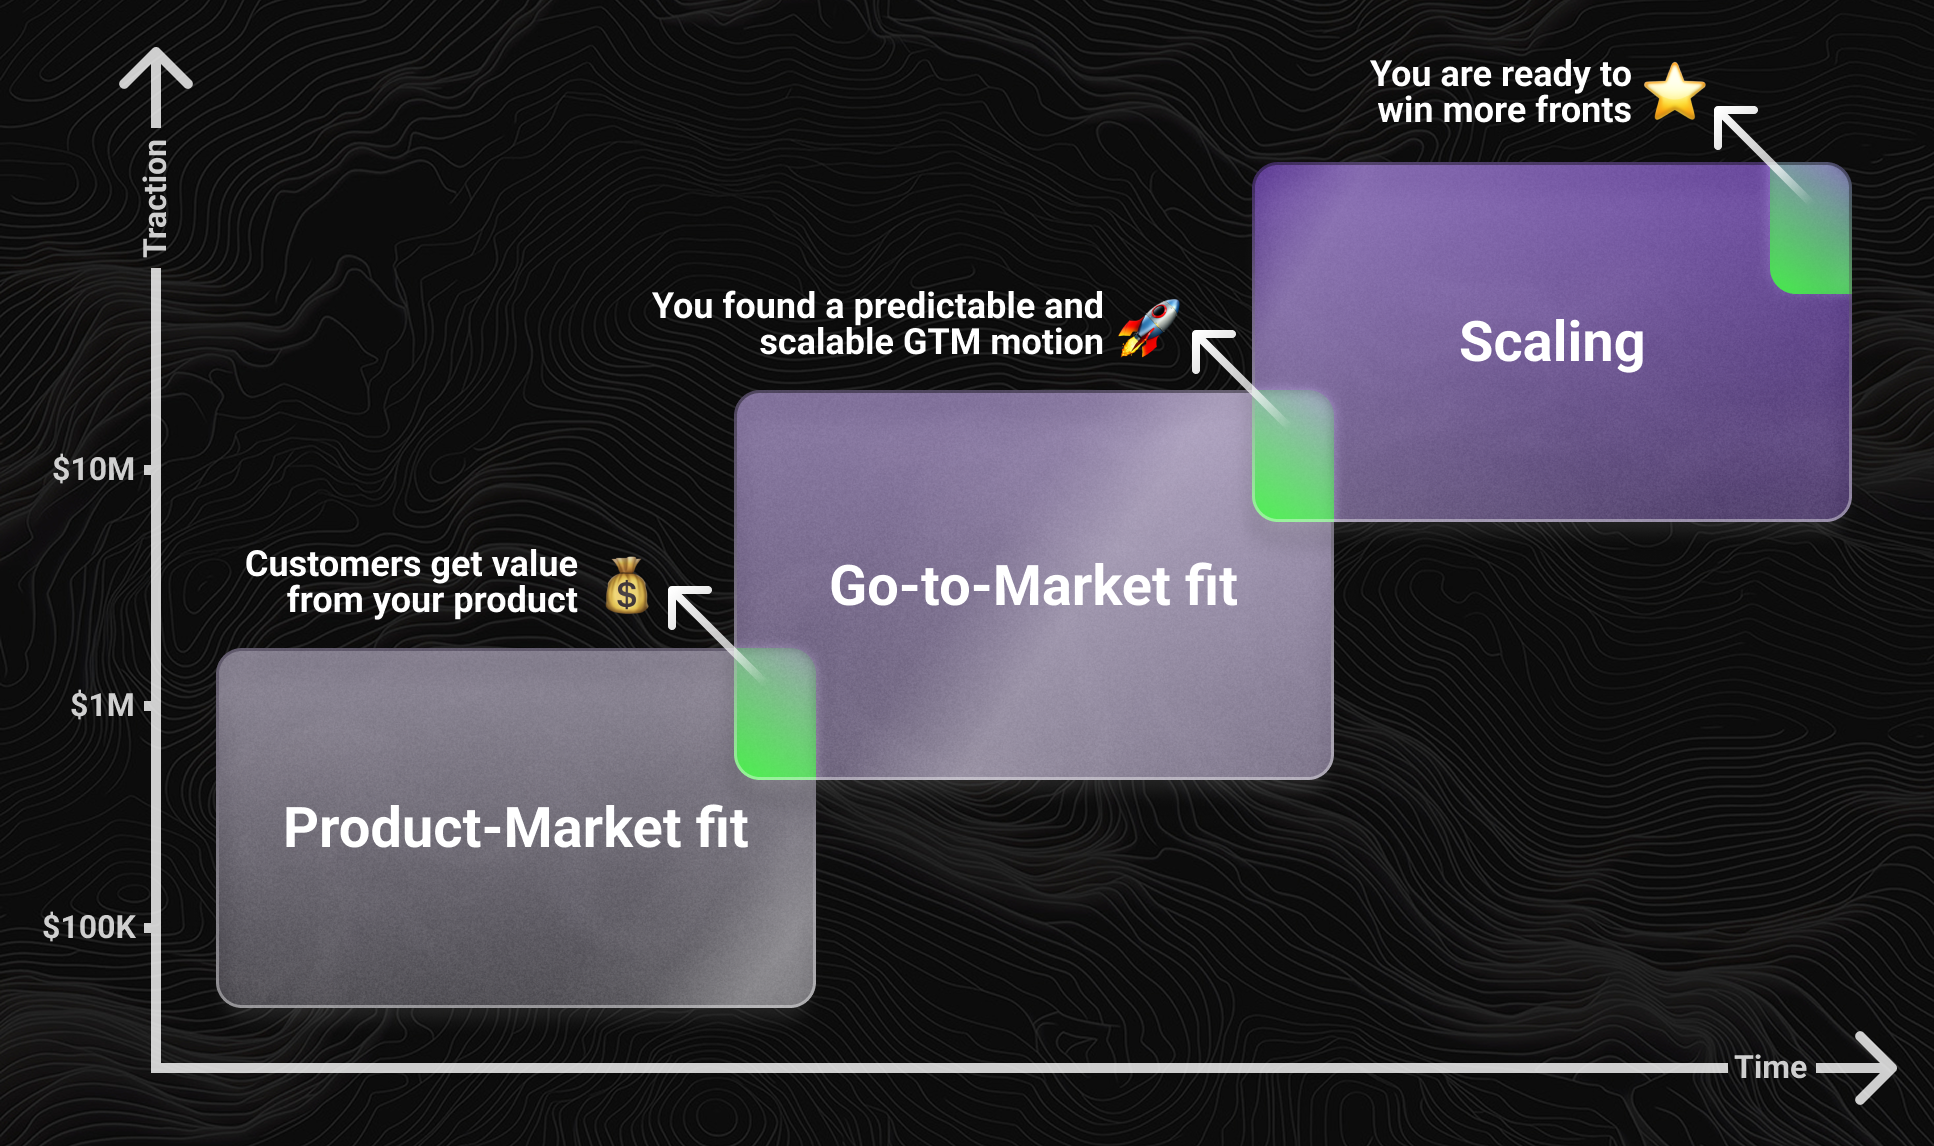 Once you've validated product-market fit and built a repeatable GTM motion, you're ready to scale with confidence.
Meet Björn W. Schäfer, entrepreneur and business angel, who has devoted his career and best-selling book to tackling this question. He will walk you through his Flywheel Effect framework and help you grasp how you can get those KPIs under control and align the processes in a way that you can maybe take a week of vacation this summer.
For me, this is one of the most challenging stages as a founder: mindset-wise, you have a transition from "eh, it will only take me 10 minutes to do it, would probably take it longer to explain it" to building teams, SOPs, and letting go.
It is hard, but as the cloning technology from Kamino (high five fellow Star Wars fans) is not available to us just yet, we have to transition there with humans and AIs that we have in our ranks today.
Let's see how Björn's framework could help us plan for a scaling stage in GTM.
The Concert That Changed EverythingPicture this: You're watching a B2B startup perform on stage. Each department—Product, Marketing, Sales, and Customer Success—has their own instrument. But instead of creating harmony, they're fighting for the spotlight. Product is playing a complex jazz solo while Marketing pounds out pop beats. Sales is screaming rock lyrics while Customer Success tries to conduct classical music.
The result? A cacophony that makes the audience cover their ears.
This is precisely what happens when your GTM teams aren't aligned.
But what if I told you there's a different way? A way where each department plays in perfect harmony, creating a symphony that doesn't just attract customers—it turns them into raving fans who keep coming back for more?
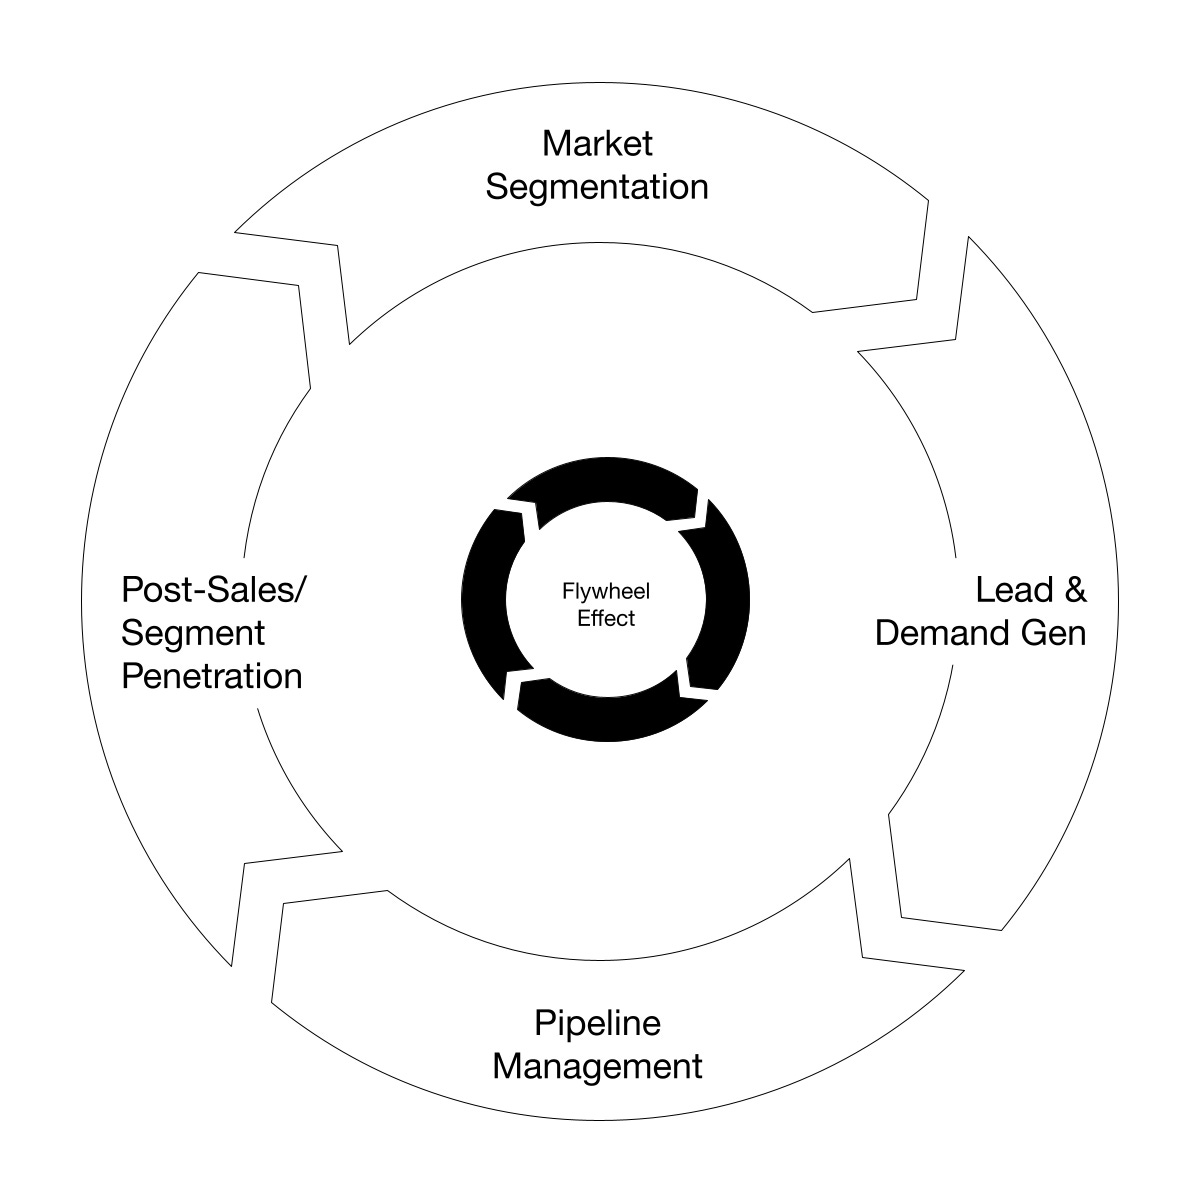
Welcome to the Flywheel Effect.
 Why Most B2B Startups Get Growth Wrong
Here's the uncomfortable truth: many B2B SaaS companies are burning cash on growth strategies that will never scale.
They're obsessed with lagging indicators like MRR growth and total customers acquired, but they're missing the fundamental principle that separates success from failure:
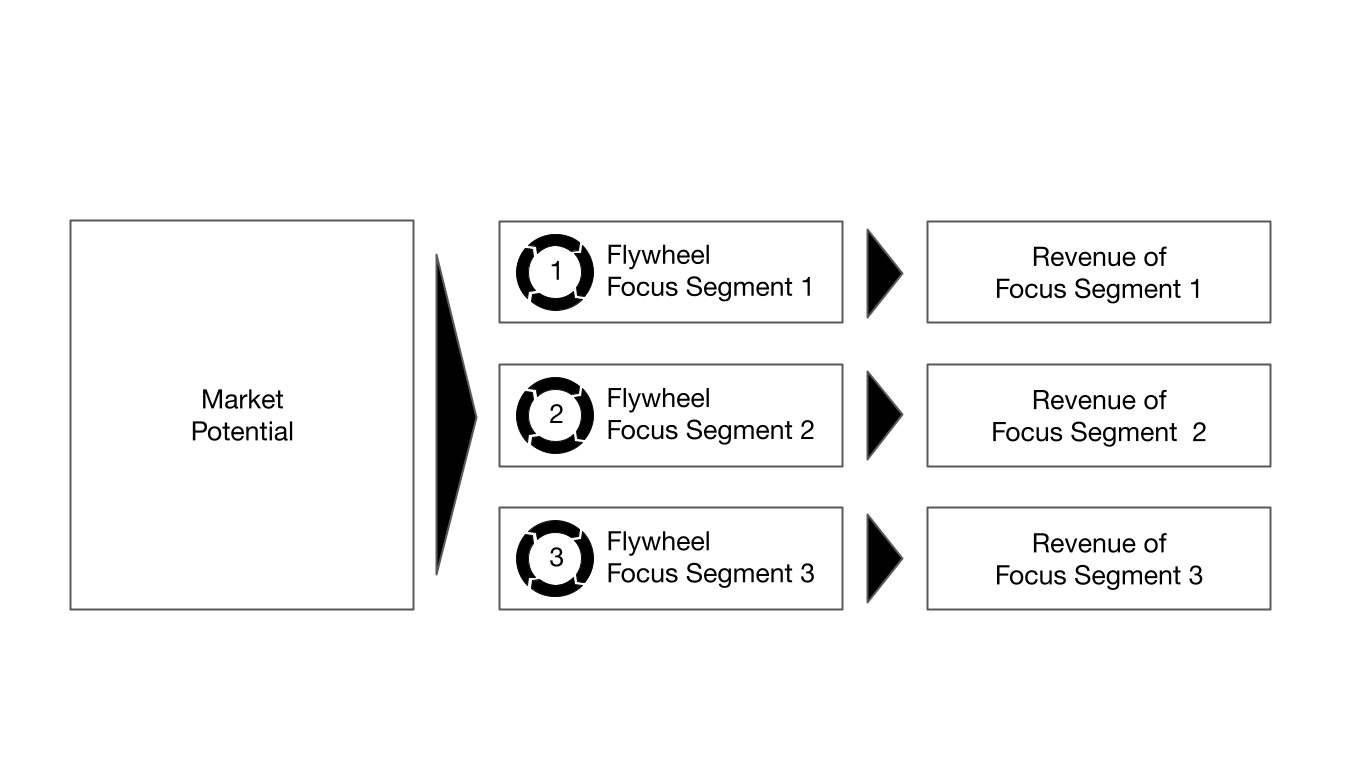
Sustainable growth comes from segment penetration, not market expansion.
The most successful SaaS companies don't try to boil the ocean. Instead, they master the art of going deep before going wide. They recognise that one customer success story in a focused segment is worth more than ten scattered wins across different markets. A similar principle applies to horizontal products, where dedicated use cases stand out. The rhythm isn’t particularly glamorous, but it is highly effective. Transform early market traction into repeatable customer impact. Do more of the same and secure similar clients. This is how you gain unstoppable momentum.
 The Formula That Turns Early Traction into Self-Accelerating Growth
After working with 150+ B2B startups from Pre-Seed to Series B, I've distilled sustainable growth into a simple formula:
(Force - Friction) × Speed = Accelerated Segment Penetration
Let me break this down:
Force = Your targeted efforts on high-value segments
Friction = Internal inefficiencies and external market resistance
Speed = How quickly you can move customers through your flywheel
But here's the kicker: Most founders focus on adding more force (hiring more salespeople, increasing ad spend) when they should be reducing friction and increasing speed.
 The Four Pillars of the Flywheel EffectPillar 1: Segment-Obsessed Customer Selection
Stop trying to serve everyone. Start by identifying your most promising segments with surgical precision based on:
Deep Customer Base Analysis
Ideal Customer Profile (ICP)
Persona mapping across the Decision Making Unit (DMU)
Cohort-based performance analysis
Strategic Market Scoring
Speed of change in the segment
Urgency to solve the problem
Competitive landscape density
Market size and growth potential
Product-Segment Alignment
Current product capabilities vs. segment needs
Roadmap priorities and development timeline
Time to value optimisation potential
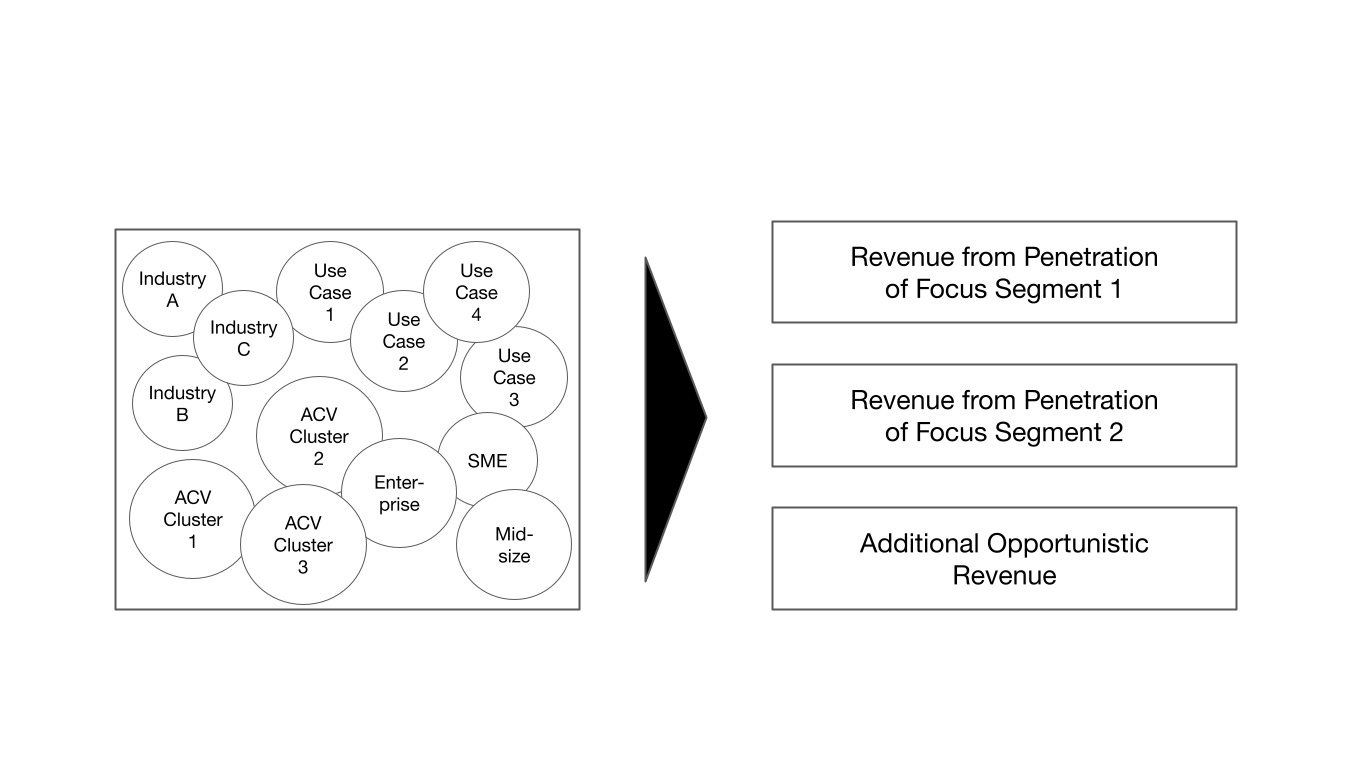
Real Example: A B2B software company discovered that while they had customers across 12 industries, 80% of their expansion revenue customers came from two verticals with employees between 1,000 and 5,000 using SAP ERP systems.
The result? They focused exclusively on these verticals and increased their win rate from 25% to 47% while cutting their sales cycle in half.
Pillar 2: Compound Pipeline GenerationMost companies treat lead generation like a numbers game. The Flywheel Effect treats it like a compound interest machine. Not just for Jason Lemkin, founder of SaaStr, the lead velocity rate (LVR) is the most critical metric SaaS companies should measure. While monthly sales merely document a result (lagging indicator), the key figure, the qualified Lead Velocity Rate (LVR), provides a clear preview of future growth (leading indicator) in real-time. Push it further and track your lead growth month-over-month, by segment:
SLVR (Segmented Lead Velocity Rate) Method =
(This Month's SQLs - Last Month's SQLs) / Last Month's SQLs × 100
You want to go the extra mile?
Don't just measure total SLVR. Measure it by share of ICP and progress by cohorts:
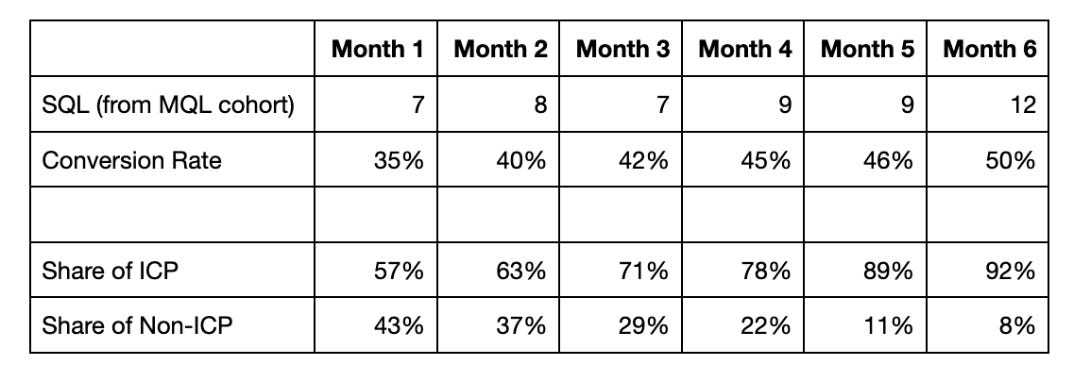
The Hidden Pattern: Notice how conversion rates improve as ICP focus increases? This isn't correlation—it's causation. When your team knows exactly who to target, everything improves: messaging, qualification, closing speed.
Power Move: Companies that double down monthly SLVR in their focus segments typically see x faster ARR growth than those focused on aggregate numbers.
Pillar 3: Focused Pipeline ConversionGame-Changing Insight: Throughout the entire customer journey, from Awareness to Consideration to Expansion, it is beneficial to prioritise or actively disqualify prospects and customers that are not a good fit. Startups I work with using a structured sales and discovery framework see 40% higher win rates and 30% shorter sales cycles. Could be SPICED, MEDDPICC, or my own CUSTOM Framework (remark: My book includes an entire chapter on this important topic):
Context Understanding
Urgency-Solution-Fit
Stakeholder Mapping
Total Alternatives Assessment
Outcome Quantification
Mutual Action Plan Development
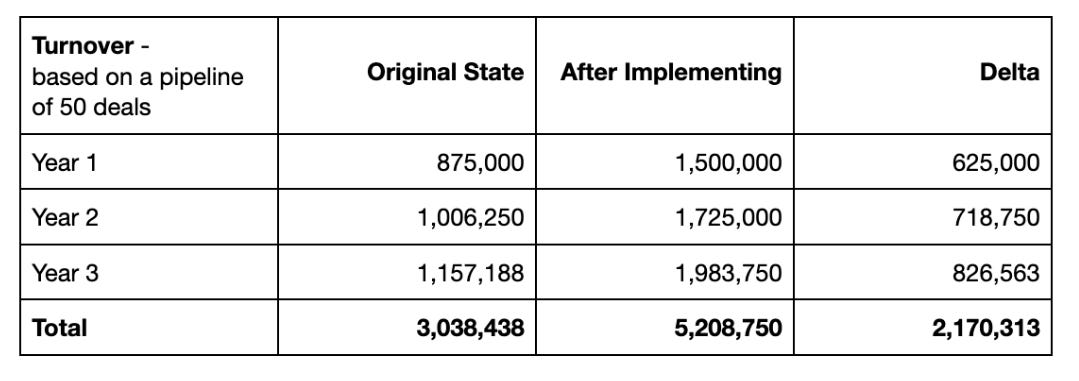
The Compound Effect: Here is a real-world example from one of my clients and its impressive impact over three years:
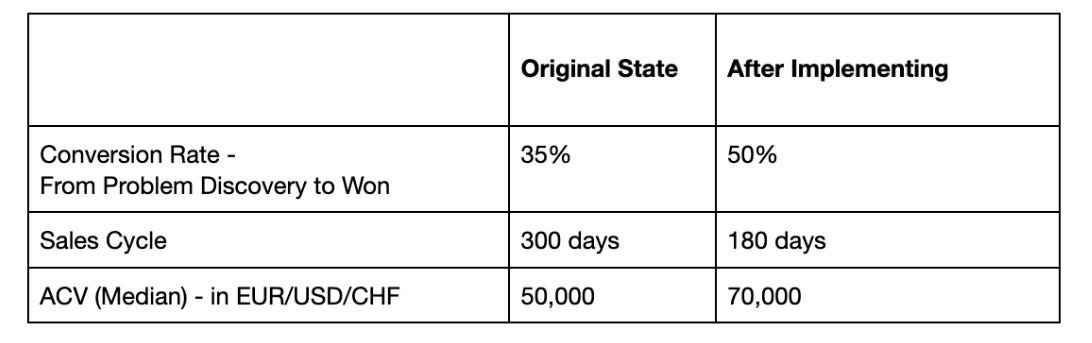
The result?
At the original state, the sales velocity was 87,500 ARR per month, after implementing it skyrocked to 250,000 ARR per month (taking the current pipeline of 50 deals). However, the compound effects for years 2 and 3, based on the NRR of 115%, are even more impressive.
 Pillar 4: Segment-Penetration Excellence
The leading indicator that predicts your future. While most founders obsess over lagging indicators (MRR, ARR), the Flywheel Effect is powered by leading indicators.
The Game-Changer: Leading Indicators for Retention and Time to Value (TTV) in your focus segments. Define a specific, measurable event that correlates with customer success:
Example: "75% of customers in Segment 1 who complete 3 specific actions within 30 days have a 92% retention rate vs. 36% for those who don't."
The Five Criteria for Bulletproof Leading Indicators:
Objectivity - No room for interpretation
Measurability - Automatically trackable
Customer Success Alignment - Directly tied to value creation
Value Proposition Alignment - Reinforces your positioning
Simplicity - Easy to understand and act upon
Power Move: Make this your North Star metric. Just imagine board meeting presentations where leading indicators for retention and time to value (TTV) are the main KPIs, rather than revenue growth and total ARR. Just imagine companies where product, marketing, sales, and customer success all optimise for the same leading indicators of success. The flywheel would start accelerating exponentially.
The Multi-Million Mistake Most Founders MakeFounders try to scale before they've achieved segment mastery.
They see initial traction and immediately think: "Let's expand to new markets, new use cases, new customer types!"
This is exactly backward.
The Flywheel Principle: Go deep before you go wide. Master one segment before expanding to the next.
Real Example: A client had moderate success across 5 different segments. When they focused on one core use case, they:
Increased win rates from 25% to 45%
Cut sales cycles from 12 months to 6 months
Achieved 142% NRR
Built a referral engine that generated +20% of new pipeline
The NRR Segment Mastery Effect:
Your Net Revenue Retention rate isn't just a metric—it's your growth engine. But here's what most founders miss: NRR must be measured by segment, not aggregate.
Real Numbers:
Segment 1: 142% NRR
Segment 2: 105% NRR
Over three years, the compound effect is staggering. Starting with 1,000,000 ARR in each segment, the Year 3 Results are:
Segment 1: 2,016,400 ARR (+102%)
Segment 2: 1,102,500 ARR (+10%)
That's an uplift of 913,900.00 in ARR!
The Compound Interest of Customer ExcellenceWhen you achieve segment mastery, every satisfied customer becomes a force multiplier:
Reference Engine: Similar companies trust recommendations from peers
Expansion Accelerator: Deep product adoption leads to bigger contracts
Referral Machine: Happy customers in one segment know prospects in the same segment
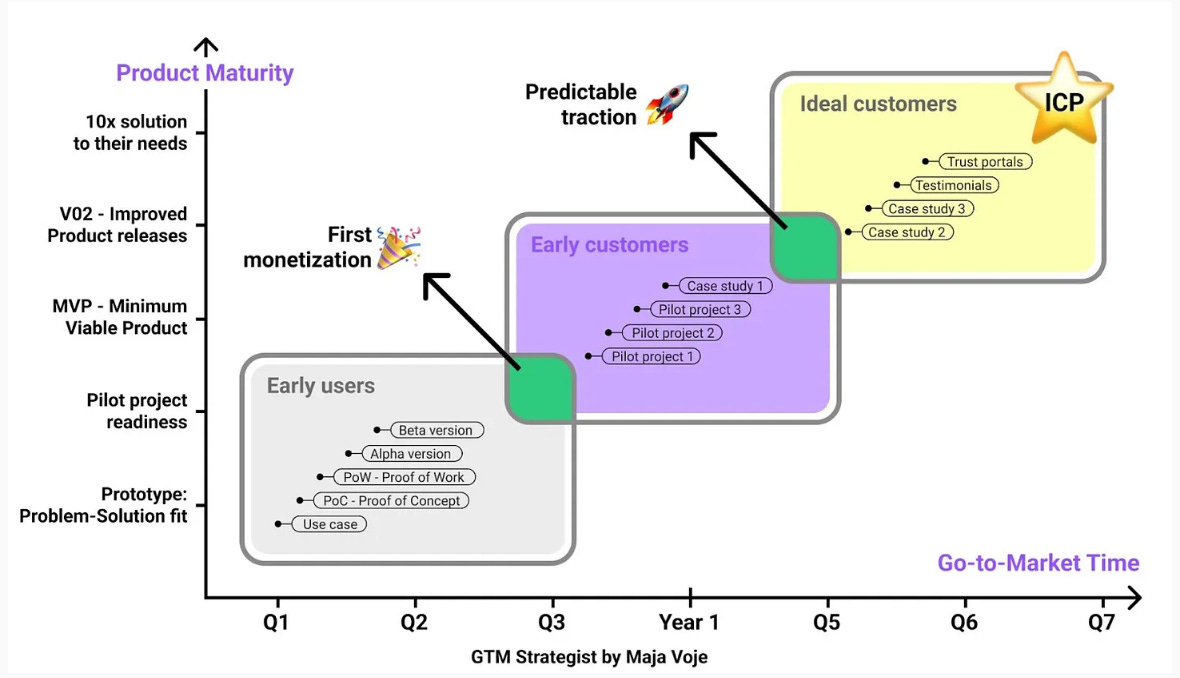 The Flywheel Effect will help accelerate your GTM journey from early customers to the ideal customer profile (ICP).
Whereas traditional companies see Customer Success as overhead. Flywheel companies see it as their best growth investment.
The Flywheel Effect isn't just another growth framework—it's a fundamental shift in how you think about building a SaaS business.
Stop asking: "How can we get more customers?"
Start asking: "How can we get more of the right customers?"
Stop prioritising: Lagging indicators like MRR growth and total ARR
Start prioritising: Leading indicators like segment-specific Lead Velocity Rate and Time to Value
Stop optimising: Individual department metrics
Start optimising: Cross-functional flywheel acceleration
The companies that master this approach don't just grow faster—they build unstoppable momentum that compounds over time.
The Flywheel Promise: While your competitors spread themselves thin chasing every opportunity, you'll become the undisputed leader in your chosen segments. Your customers will become your best salespeople. Your growth will compound. Your flywheel will spin faster and faster until it becomes unstoppable.
Your next step? Pick one segment. Go deep. Build your flywheel. Then watch as your focused approach creates exponential returns that scattered efforts never could.
The stage is set. Your instruments are tuned. It's time to create the symphony of growth that turns your startup into a market-dominating force.
Are you ready to spin your flywheel?
Want to dive deeper into the Flywheel Effect? This framework comes from Funky Flywheels, the definitive guide to Go-to-Market excellence for B2B startups. Based on insights from 150+ companies and proven in the trenches of European SaaS growth.
The world doesn't need another generic B2B SaaS or AI startup. It needs companies that master their craft, serve their customers exceptionally, and build flywheels that create unstoppable momentum.
About the Author: BJÖRN W. SCHÄFER is a highly trusted voice in the B2B startup ecosystem across Europe as the founder of Rowing8, podcast host, and business angel. He has shaped the growth journeys of over 150 B2B startups from pre-seed to Series B, accumulating more than €250 million in ARR and funding rounds led by 20VC, Google Ventures, Cherry Ventures, Creandum, UVC, Atomico, and HV Capital. His unique insights have earned endorsements from leading investors and industry veterans.
Get the GTM Checklist with AI Prompts ✨Go-to-Market Checklist with AI Prompts includes 100+ actionable tasks designed to help you win new customers for tech products in under 14 days.
Packed with proven templates, examples, and detailed AI prompts, it guides you from launch planning all the way to profitable, scalable growth - faster and smarter.